Bitcoin Braces for Correction: Key Levels to Watch for a Dip-Buying Opportunity
- Bitcoin clung to the $51,700 support at the start of the week, but signs of weakened buying support emerged as it retraced towards $51,000 amid intensified selling pressure.
- Short-term analysis indicates an intermediate support at $50,700, with a potential correction trend triggered by a daily close below this level, targeting the next support at $49,500.
- While the broader view suggests Bitcoin is tracking the upper edge of an ascending channel on the weekly chart, a potential correction looms.
- In 2024, invest like the big funds from the comfort of your home with our AI-powered ProPicks stock selection tool. Learn more here>>
In the first half of the week, Bitcoin held onto the $51,700 support, a level we’ve been monitoring since February 15.
However, as of yesterday, there are signs that the buying support at this price has weakened.
The cryptocurrency is currently in the second phase of consolidation after the initial February surge. The price action was similar to when it was in the $42,500 – $43,700 range in the first week of February, with a pause in the uptrend on February 15.
In this article, we will assess the cryptocurrency’s situation and focus on key trade levels to keep an eye on.
Levels to Watch
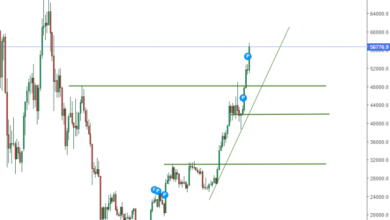
During the past week, Bitcoin tested levels around $52,000, encountering resistance at $52,250.
Despite buyers successfully defending the $51,700 support, the BTC price has retraced towards the $51,000 mark as selling pressure intensified since yesterday.
 Bitcoin Price Chart
Analyzing short-term price movements reveals an intermediate support at $50,700. If there’s a daily close below this level, it might trigger a correction, potentially bringing Bitcoin down to around $49,500, the next support.
After losing this support, the next potential stop is around $47,300.
Despite increased selling pressure, a resurgence of buyers around the $50,700 zone could lead to a new short wave towards $52,800.
An upward breakout might continue the short-term upward trend up to $55,000, with initial resistance seen at $53,100.
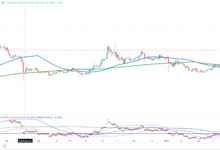
Examining the daily chart, Bitcoin entered overbought conditions in February according to the Stochastic RSI. The recent bearish trading suggests a short-term correction.
The support point at $50,700, corresponding to Fib 0.144 from the last rise, gains significance.
How to Trade It
The uptrend, fueled by ETF purchases, has slowed due to declining demand. Blockchain data indicates profit-taking by long-term BTC holders after the last bullish wave.
If the attempt to breach the critical support at $50,700 accelerates, it could trigger a correction.
 Bitcoin Weekly Price Chart
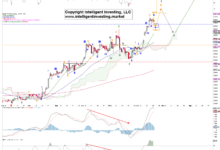
From a broader viewpoint, Bitcoin is currently tracking the upper edge of an ascending channel on the weekly chart. The Weekly Stochastic RSI indicates bullish potential in its current position.
However, the limited movement within the upper channel this week suggests a potential correction might be on the horizon.
Given this perspective, BTC is expected to gain more confidence in its upward trajectory after a pullback to an average of $48,000, considering the mentioned short-term support levels.
On the flip side, for the cryptocurrency to continue its path without correction, it must reclaim support at $51,700 and close the week around $53,000.
Meeting these conditions would convince investors that BTC has broken out of its narrow range and could trigger a swift bullish surge toward $55,000, accompanied by an increase in buyer activity.
This scenario hinges on the ongoing significance of spot Bitcoin ETF trading in influencing the Bitcoin chart.
Failure to meet these conditions within the next 48 hours could lead to an escalation in selling pressure.
***
Take your investing game to the next level in 2024 with ProPicks
Institutions and billionaire investors worldwide are already well ahead of the game when it comes to AI-powered investing, extensively using, customizing, and developing it to bulk up their returns and minimize losses.
Now, InvestingPro users can do just the same from the comfort of their own homes with our new flagship AI-powered stock-picking tool: ProPicks.
With our six strategies, including the flagship “Tech Titans,” which outperformed the market by a lofty 1,427.8% over the last decade, investors have the best selection of stocks in the market at the tip of their fingers every month.
Subscribe here and never miss a bull market again!
Disclaimer: